Measure & Report Readiness Level
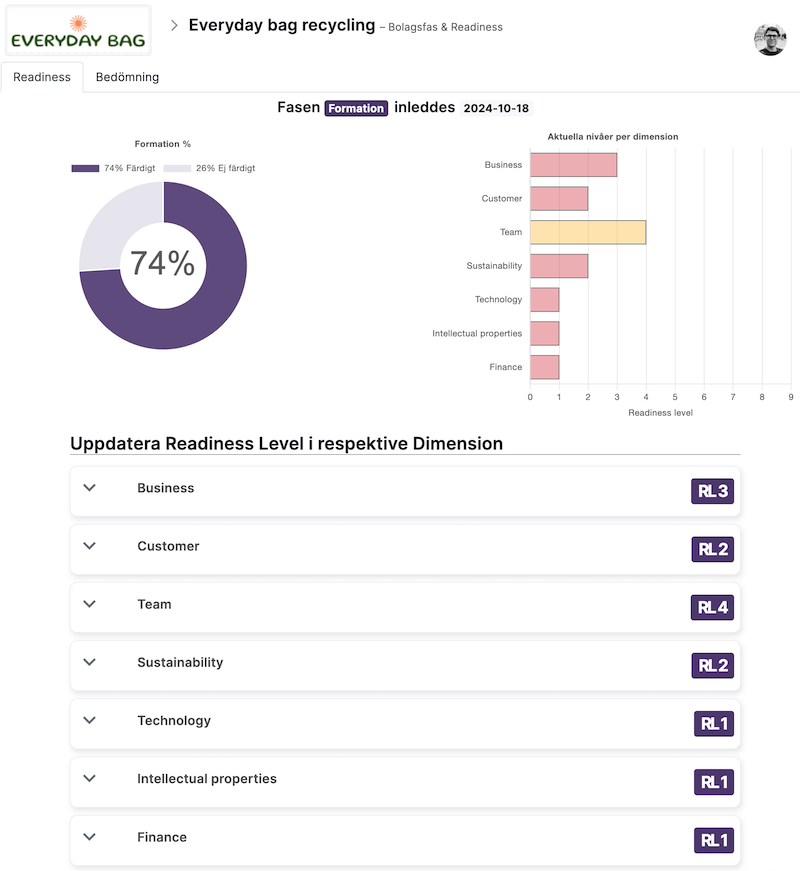
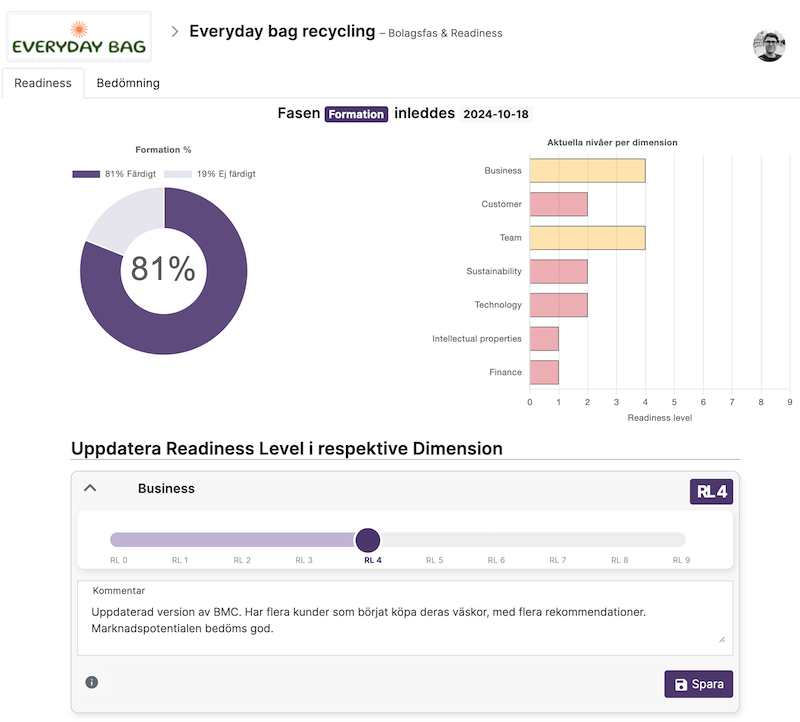
Measuring a business idea and its progress through Readiness levels divided into different dimensions is a way to track its progress and maturity. Incubators can work differently with dimensions that suit their operations and focus, you choose which ones are important to you. Below you can see some examples of common dimensions that incubators typically choose to work with.

- Example dimensions
- Technology (TRL)
- Marketing (MRL)
- Business (BRL)
- Customer (CRL)
- Team (TMRL)
- IPR (IRL)
- Finance (FRL)
- Sustainability (SRL)
You can create your own dimensions and readiness levels that are important to you
If your incubator uses Readiness Level and measures this on your Startups, you can use a customizable module in Incu to facilitate this. The tool provides an opportunity to create which Dimensions and Readiness Levels are relevant to you and that you want to use to measure your Startups development. You can of course also choose names for the different phases. Incu provides the framework with functionality to measure and report, but you choose how you want to configure it. Simple and easy!
Work with RL individually on each Startup in your portfolio of business ideas


Reporting
Question: Can I go back in time and see what the different levels were on a specific date?
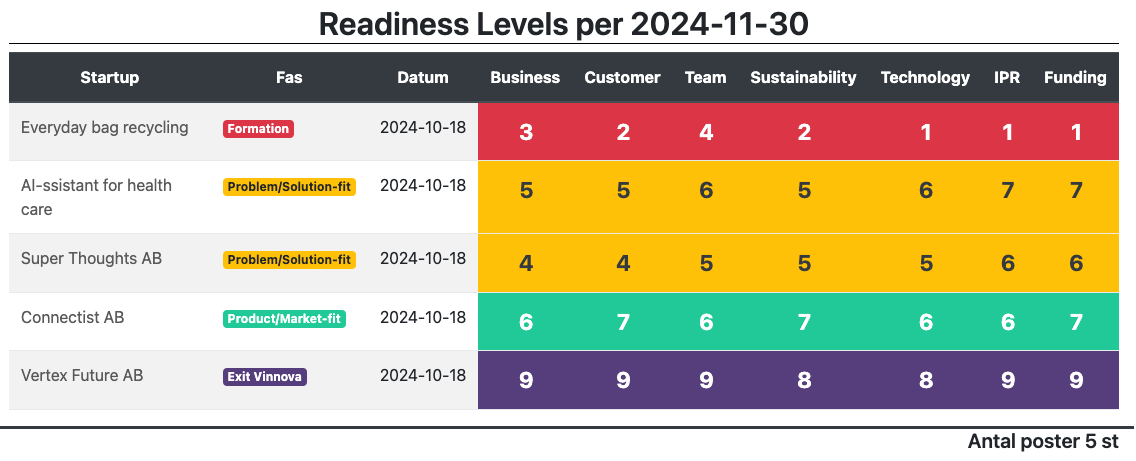
Answer: Yes! If in September you need to report what levels your portfolio had at the mid-year point on June 30, what happens if someone has updated levels since then? Won't I get the most recently updated levels instead? No - you won't! Since all history and updates of Readiness Levels are saved in Incu, you can easily go back in time and retrieve a snapshot of what the different levels were at a specific date.
Below is an example of a report from Incu. The report lists 5 Startups and shows the levels that were current as of November 30, 2024, even if changes have occurred since then. We get a quick visual overview of which phases and levels each Startup had at the date. Reporting data is retrieved ready-made, with just a few clicks.

Save time & resources
You might want to forget everything that has to do with:
- Excel's error message "The file is locked for editing by [Username]. Open it as read-only or try again later."
- Emailing around / sending in Teams chat: "Can whoever has the reporting file open in Excel close it. I need to enter my numbers."
- Wait. Try again. Wait a bit longer.
- Emails with new versions of Excel sheets that need to be synced with your master sheet.
- Having to cut and paste from one sheet to another.
- Now I got yet another new version from colleague XY, so I guess I'll save that on my computer as
_FINAL.xls. Oh, that already exists? Then I'll use _FINAL2.xls. - Not being sure which is the most recently updated version.
Summary
- check_circle You choose dimensions yourself
- account_tree All Startups have their own data
- save All history is saved for each Startup
- timeline Report snapshots from a specific date, even backwards in time
- speed Save time & resources and get a good overview - every day
- settings Dynamically configurable functionality to suit your needs!